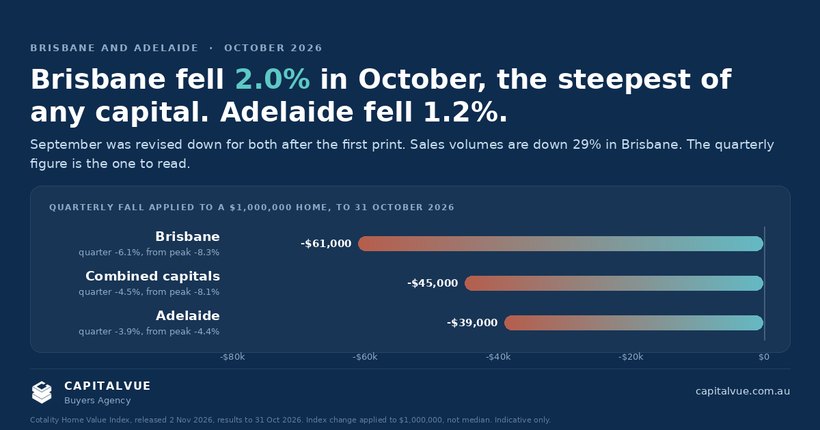
Brisbane recorded the steepest fall of any capital in October. Adelaide fell by less than half as much. The September figures for both were revised down after we published them, and this piece says by how much.
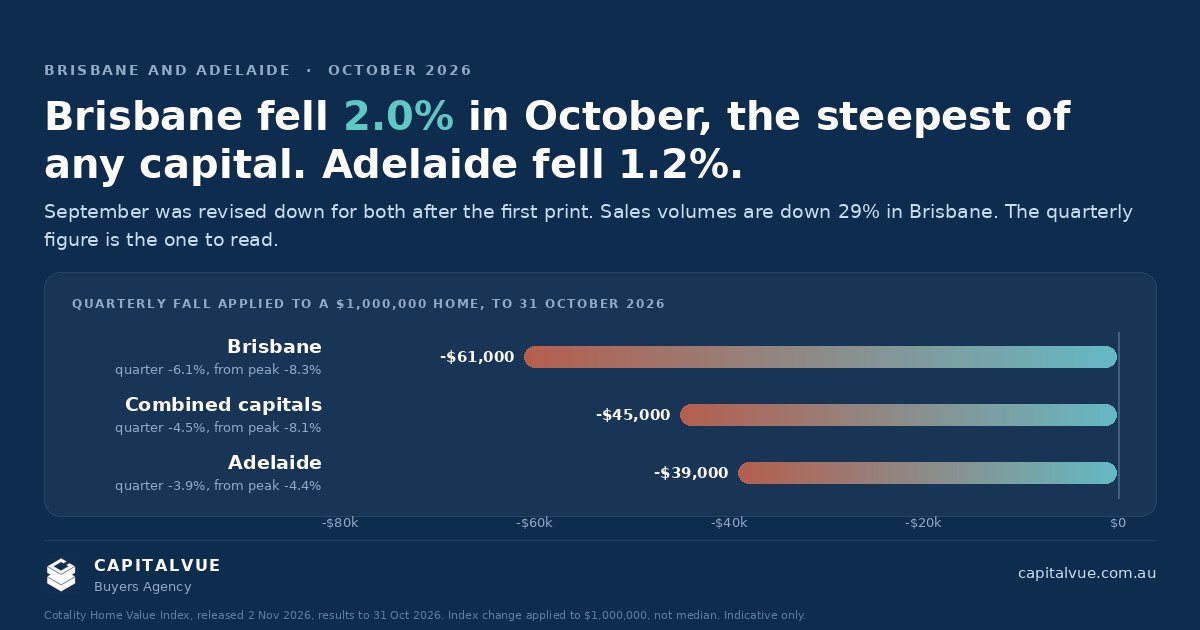
Brisbane dwelling values fell 2.0% in October 2026 and are down 6.1% over the quarter. Adelaide fell 1.2% for the month and 3.9% for the quarter. Nationally the index fell 1.2%, its seventh consecutive monthly decline, and the combined capitals are now 8.1% below their March peak, which Cotality says is the fastest seven-month fall in forty years. The 2022 to 2023 downturn took 7.0% off the capitals over the same number of months.
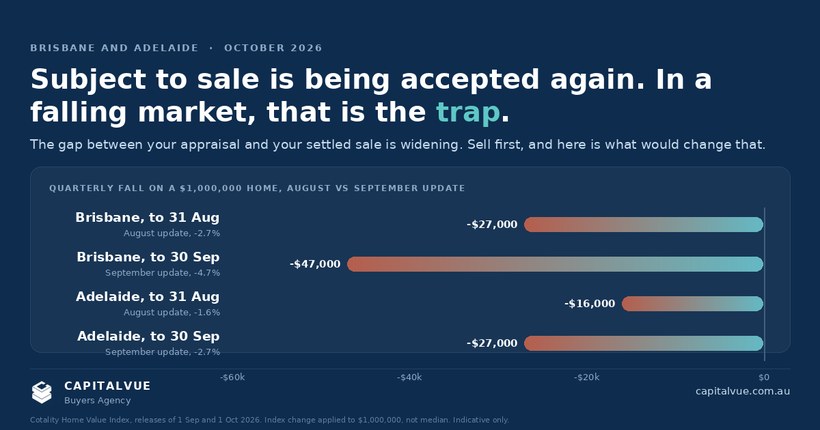
A correction first. Our September update reported Brisbane down 1.5% and Adelaide down 1.3% for that month. Cotality's November release revises those to 2.1% and 1.7%. The index is recalculated as late sales settle and are added, and in a falling market the late sales tend to be the weaker ones. That is a known property of the index, not an error, and it means the first print in any month is now more likely to understate the fall than overstate it. Read the quarterly figure, which absorbs most of the revision, before the monthly one.
Then the reason the next release will be weaker still. On 3 November 2026 the Reserve Bank lifted the cash rate target by 25 basis points to 4.85%, its fifth increase this year and the highest setting since late 2008. The decision was not unanimous: six members voted for the increase and three to hold at 4.60%. The statement says inflation remains elevated and broadly based, is expected to stay above 3% for the coming year, and is not expected to reach the top of the 2 to 3% target range until late 2027. It describes a further tightening in financial conditions as warranted. Lenders generally pass a change through within a few weeks, so the average variable rate used in our calculator and in the carrying-cost figures across this site will move after this piece is published, and we will update the figure when Canstar does.
The October data below was collected before that decision. It describes a market that had already absorbed four rate rises, not five.
| Market | Month | Quarter | Annual | From peak | Gross yield | Median dwelling value |
|---|---|---|---|---|---|---|
| Brisbane | -2.0% | -6.1% | +0.4% | -8.3% (May 2026) | 3.7% | $1,018,401 |
| Adelaide | -1.2% | -3.9% | +3.7% | -4.4% (May 2026) | 3.7% | $916,860 |
| Regional Qld | -0.9% | -2.7% | +3.5% | -4.0% (May 2026) | 4.3% | $826,667 |
| Regional SA | -0.3% | +0.1% | +9.6% | -0.5% (Aug 2026) | 4.4% | $568,790 |
| Combined capitals | -1.4% | -4.5% | -4.8% | -8.1% (Mar 2026) | 3.8% | $954,905 |
| National | -1.2% | -3.9% | -2.8% | -6.7% (Mar 2026) | 3.9% | $884,855 |
Source: Cotality Home Value Index, released 2 November 2026, index results as at 31 October 2026.
Two things stand out. Brisbane's annual figure has collapsed from 5.9% in the September print to 0.4% now, which means the whole of the past year's growth has been given back and the next release will almost certainly show Brisbane negative over twelve months. Adelaide is still 3.7% up over the year and only 4.4% off its peak, against 8.3% for Brisbane. Adelaide is correcting at roughly half Brisbane's pace, which was also the pattern in September.
Cotality's Tim Lawless put the mid-sized capitals, Brisbane and Adelaide among them, "well and truly in a correction" and said virtually every suburb across them fell over the three months. Regional SA, up 0.1% for the quarter, is the only market in either state that did not fall.
| Market and type | Month | Quarter | Annual | Gross yield | Median value |
|---|---|---|---|---|---|
| Brisbane houses | -2.0% | -6.2% | -0.2% | 3.5% | $1,111,530 |
| Brisbane units | -1.7% | -5.6% | +3.4% | 4.3% | $811,084 |
| Adelaide houses | -1.2% | -3.9% | +3.7% | 3.5% | $977,551 |
| Adelaide units | -1.6% | -3.8% | +3.4% | 4.6% | $661,647 |
Source: Cotality Home Value Index, released 2 November 2026.
Brisbane houses are now negative over the year, the first of the four to cross that line. In September we noted Brisbane units carried the strongest annual growth of the four at 8.5%; a month later that is 3.4%, and the unit median has fallen from $834,627 to $811,084. The unit premium over houses has narrowed but not closed: units in both cities are falling slightly more slowly over the quarter and still carry close to a full point of extra yield.
The September caution stands. A yield gap is not a reason to buy a unit, and body corporate exposure does not get cheaper in a downturn. It is a reason to assess the two with different spreadsheets, and in a market where the binding constraint is how much the bank will lend, the asset that clears at $661,647 is in a different borrowing bracket from the one that clears at $1,111,530.
National vacancy reached 2.3% in October, the highest since January 2022 and close to the decade average of 2.4%, though still well below the pre-COVID average of 3.3%. Cotality reports vacancy higher than a year ago in every capital except Darwin. Rents rose 0.9% nationally over the quarter in seasonally adjusted terms, the smallest quarterly rise since January 2025.
| Market | House rent growth, annual | Unit rent growth, annual |
|---|---|---|
| Brisbane | +6.7% | +6.1% |
| Adelaide | +6.3% | +6.4% |
Source: Cotality Home Value Index, released 2 November 2026, annual change in rents to October 2026.
Lawless attributes the slowdown to renters approaching a ceiling on what they can pay after a 52% rise in rents over six years, and to slower overseas migration. Both cities are still recording rent growth above 6%, well ahead of the national pace, and with values falling faster than rents are slowing, gross yields keep rising. The combined capitals yield of 3.77% is the highest since May 2015. Lawless added that yields at this level are still nowhere near what is needed for a neutral or positive cash flow once investor mortgage rates near 7%, insurance, strata and maintenance are counted, and that established-property investors lose the current negative gearing treatment from July next year. We covered the structure question in a separate piece; it is worth re-reading before the tax change rather than after.
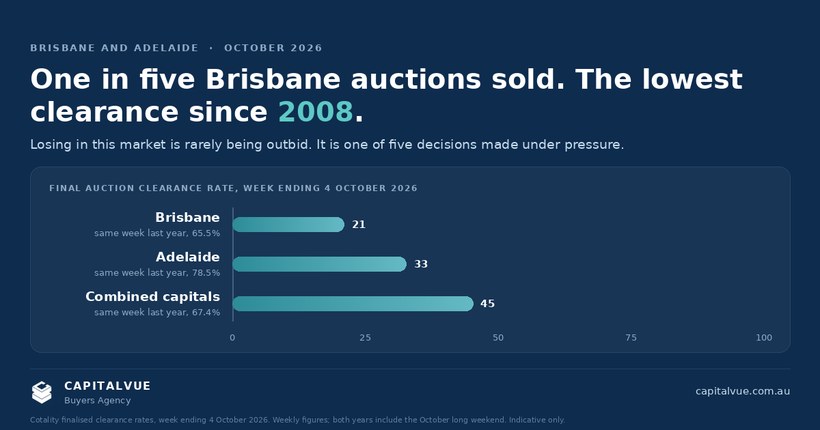
Sales volumes over the three months to October ran 23% below a year ago nationally and 18% below the five-year average. Brisbane is down 29% year on year, second only to Sydney. New listings are tracking almost 18% below average, yet total advertised stock in the capitals is at its highest level for this time of year since 2019, because homes are taking longer to clear. The median time on market is 39 days, the longest since August 2020. Vendor discounting has reached 4.7%, the largest since May 2019. Combined capital auction clearance rates are consistently below 50%.
Lawless's summary is the one to keep: buyers have more stock, more leverage and no urgency, "but despite this being a buyer's market, they are noticeably absent, reflecting low confidence and ongoing serviceability barriers." The market is not short of sellers. It is short of people who can get a loan approved at the current assessment rate.
That has two practical consequences we have already written about. The first is that a clean offer beats a higher one. With most auctions passing in and most offers the only offer, buyers are losing on conditions and timing, not price, and we set out the five patterns last week. The second is that subject-to-sale offers are being accepted again, and the revision above shows why that is dangerous. A buyer who signed in early October against the first September print has already seen the appraisal on their own home move further than the print said. Sell first remains our answer, and the conditions that would change it are on that page.
| SA3 region | Area | Median value | Annual change |
|---|---|---|---|
| Ipswich Hinterland | Ipswich | $889,587 | +7.9% |
| Sherwood - Indooroopilly | Brisbane West | $1,181,587 | +3.8% |
| Redcliffe | Moreton Bay North | $1,008,050 | +3.6% |
| Gawler - Two Wells | Adelaide North | $813,500 | +7.3% |
| Onkaparinga | Adelaide South | $893,259 | +6.7% |
| Campbelltown (SA) | Adelaide Central and Hills | $1,103,246 | +6.2% |
Source: Cotality Home Value Index, released 2 November 2026, top-performing SA3 regions by annual change in dwelling values, data at October 2026, minimum 20 sales observations.
These are twelve-month figures and every one of them is lower than it was a month ago. They describe where values held up best through a year that ended in a correction, not where values are rising now. Lawless's own line is that virtually every suburb in both cities fell over the quarter. Treat the table as a map of relative resilience, and treat any suburb-level claim of current growth with suspicion until the quarterly figure supports it.
Cotality's stated expectation is a gradual drift lower rather than a sharp fall, with the balance of risks to the downside and the trajectory depending on inflation, rates and the labour market. That is their forecast, not ours, and the revisions to September show how much a single print can move.
For a buyer with finance assessed, the position is the one we described in September, with another month of evidence behind it: more stock, longer days on market, vendors discounting more, and almost no competing offers. For a buyer without finance assessed, the position has not improved at all, because each rate rise removes more borrowing capacity than the market removes from prices. Cotality's own arithmetic has borrowing capacity down 11.5%, or about $105,000, through the cycle if November adds another 25 basis points, against a $63,400 fall in the national median since March. We built the same comparison in the borrowing capacity piece and the gap has widened since.
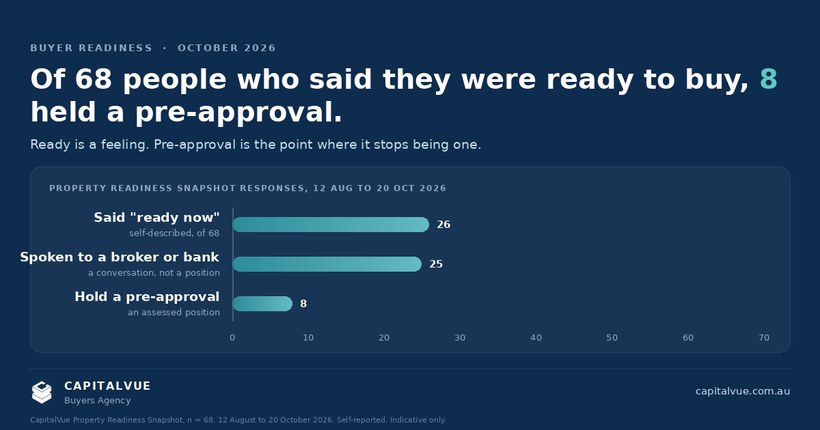
Which is the whole case for getting the finance question answered before the property question. Pre-approval, explained covers what an assessed approval is and how long it lasts. If you are earlier than that, the Property Readiness Snapshot will tell you which of finance, brief or timing to sort first. If you have found the property and want the evidence, the terms and the negotiation run against this market rather than last year's, that is what Evaluate and Negotiate is for.
General information only, not financial product advice, credit assistance, legal advice, tax advice, or a recommendation to buy or sell any particular property. Figures are indicative and current as at November 2026. Sources: Cotality (formerly CoreLogic) Home Value Index, released 2 November 2026, index results as at 31 October 2026, for all value, rent, yield, sales, listings, days on market and vendor discounting figures, and for the revised September 2026 monthly results; Cotality Home Value Index, released 1 October 2026, for the September figures as first published; Reserve Bank of Australia, Statement by the Monetary Policy Board: Monetary Policy Decision, 3 November 2026, cash rate target 4.85%, six votes to three. SA3 region figures are twelve-month changes in dwelling values and are not a forecast. Past performance is not a reliable indicator of future performance. Property values can fall. Consider your own circumstances and obtain independent financial, credit, legal and tax advice before making a property decision. CapitalVue is a licensed buyers agency operating in South East Queensland and Adelaide, licensed QLD 4769773 and SA 335016.
Tell us where you are at and we will tell you what we would look at next. You will hang up with a plan, not more questions.