Rate rises do not remove buyers. They remove the amount each buyer is allowed to borrow. Everything else in this market follows from that one mechanism.
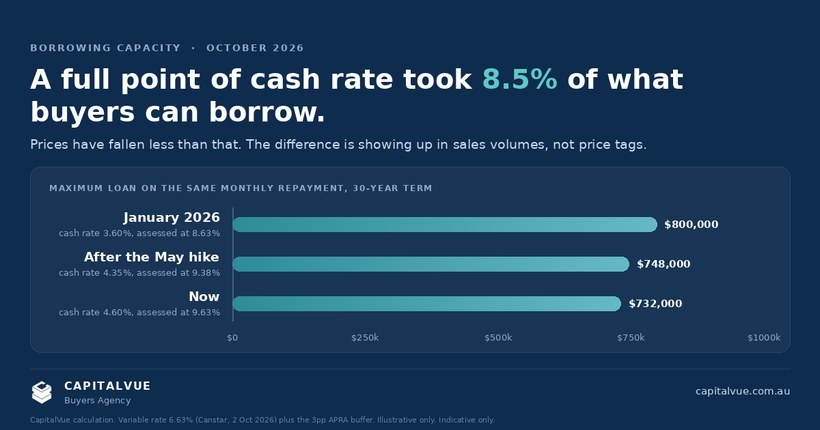
The cash rate target has risen a full percentage point in 2026, from 3.60% at the start of the year to 4.60% after the Reserve Bank's decision on 29 September. On the same monthly repayment, that removes about 8.5% of what a borrower can be lent.
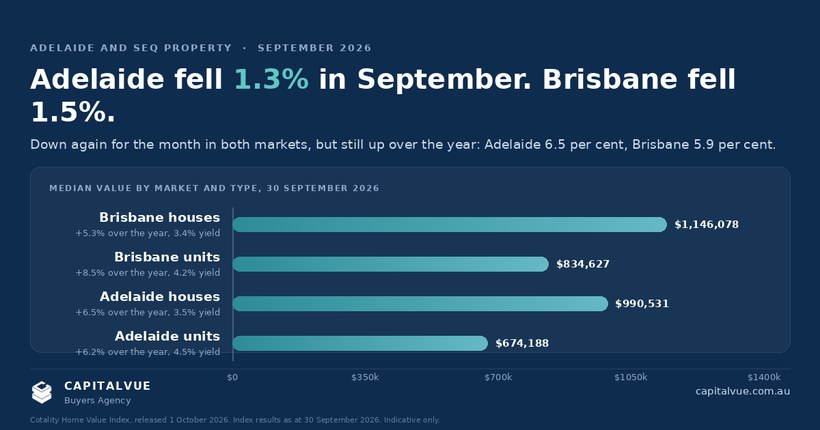
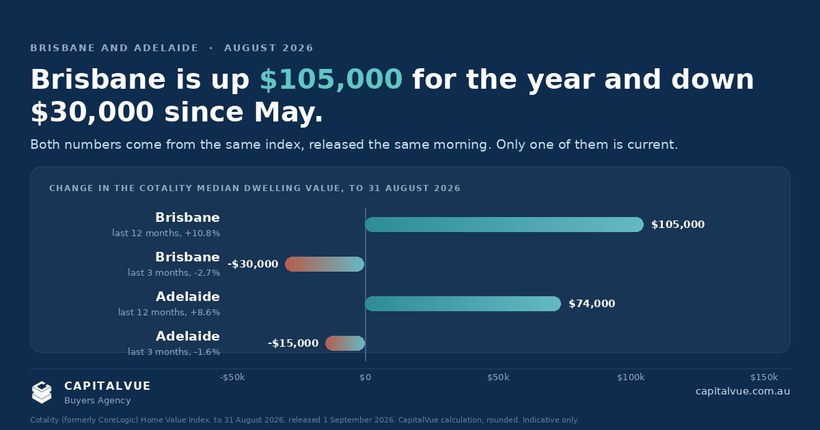
Dwelling values have not fallen 8.5%. Brisbane sits 5.4% below its May 2026 peak and Adelaide 2.9% below the same peak. The gap between those two numbers is the most useful thing in this month's data, and it explains what the market actually looks like on a Saturday morning.
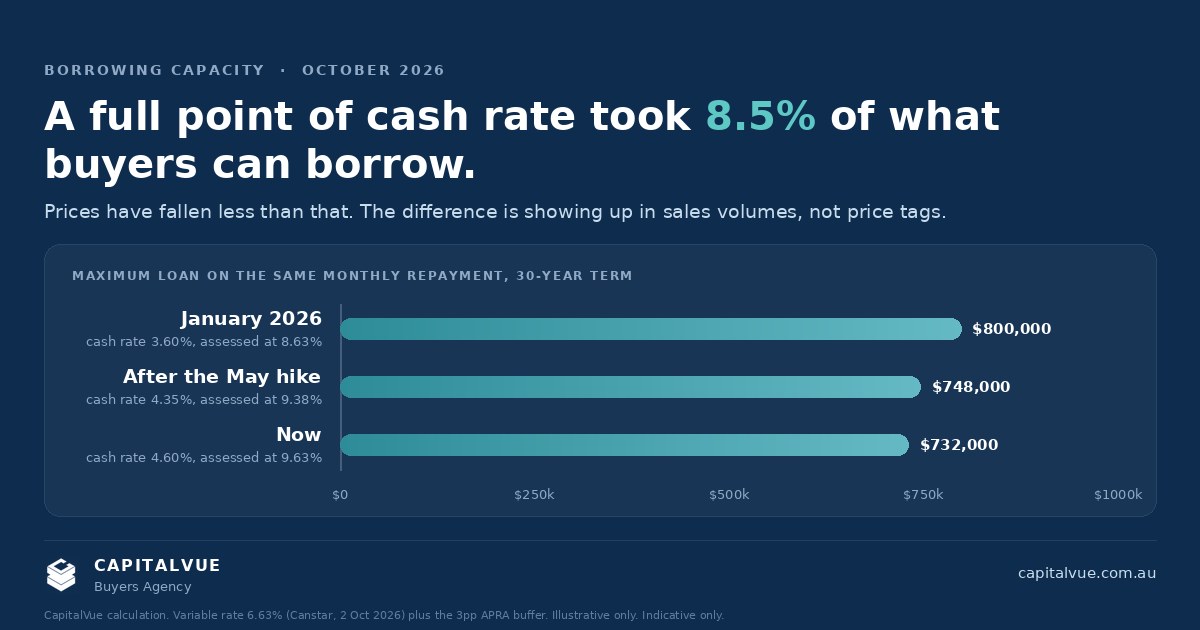
Work it through on a single borrower. Take someone who could be lent $800,000 in January. Lenders assess at the loan rate plus the 3 percentage point serviceability buffer APRA has required since October 2021. The average variable owner-occupier rate was around 6.63% at the start of October, so that borrower is now assessed at 9.63% rather than the 8.63% that applied in January. Same income, same repayment, same term. The number the lender will write has fallen to roughly $732,000.
That is not a forecast. It is arithmetic, and it has already happened.
If capacity falls 8.5% and prices fall 3% to 5%, the shortfall has to appear somewhere. It appears in turnover. Cotality estimates home sales over the three months to September ran 19.1% below the same period last year nationally, and Brisbane recorded the sharpest fall of any capital at 27.2%. New listings coming to market were 9.2% lower than a year ago, yet total advertised stock was 23.1% higher, because the rate of sale fell faster than the rate of new listings. Capital city homes now take a median of 39 days to sell against 23 days a year ago.
Sellers are not meeting the new capacity. They are withdrawing, or waiting, or sitting on the market for an extra two and a half weeks. That is what a market looks like when the constraint is credit rather than desire, and it is the single most important thing for a buyer to understand right now, because it is also where the negotiating leverage comes from.
Australia has been through eight completed peak-to-trough housing cycles since the mid-1990s. Across those eight, the average downturn ran about eight months and took 2.9% off values. The average upswing that followed ran close to three years and added 32.3%.
| Phase | Average length | Average change |
|---|---|---|
| Downturn | About 8 months | -2.9% |
| Following upswing | Close to 3 years | +32.3% |
Source: Domain Price Cycle data, reported 4 July 2026. Eight completed cycles since the mid-1990s.
The deepest of the eight was the 2016 to 2019 episode, which took 8.5% off national values over 18 months. The current downturn is in its sixth consecutive month and national values are 5.2% below their March 2026 high. By length it is still short of 2016. By depth it is already two thirds of the way there.
The asymmetry is the point, and it is visible in Cotality's own longer series. Brisbane dwelling values are 5.4% below their peak and 105.3% higher than they were ten years ago. Adelaide is 2.9% below peak and 104.3% higher over the decade. A buyer who sat out the last three downturns waiting for a better entry paid for the privilege several times over.
None of that guarantees the pattern repeats. Eight observations is a small sample, the composition of the market has changed, and an average hides the one cycle that behaved differently. It does tell you the shape of the risk: in this market the cost of being early has historically been small and the cost of being absent has historically been large.
In every one of the eight, the catalyst for recovery was the interest rate cycle turning. The 2019 episode had a second ingredient, policy uncertainty, and prices rebounded once an expected tax change did not proceed at that year's federal election.
The mechanism is the same one running in reverse. A rate cut does not create buyers. It hands back borrowing capacity to the buyers already there, all at once, and they compete against the stock that accumulated while they could not transact. That is why recoveries in this market tend to be faster than the downturns that precede them, and why the extra stock and the longer selling times are the first conditions to disappear.
Where the cycle turns next is not something anyone can tell you with confidence. Westpac's economics team expects a further increase at the Reserve Bank's 2 to 3 November meeting. Cotality's own view in the October release is a gradual drift lower in values rather than a material downturn. Both are forecasts, both are from people who revise them, and the rational position for a buyer is to make the numbers work at 4.60% with room above it rather than to plan around a turn whose date is unknown.
The Westpac and Melbourne Institute Consumer Sentiment Index fell 4.7% to 80.4 in October, its sharpest pull-back concentrated in the responses collected after the rate decision. Consumers assessing their family finances against a year ago came in at 66.9 against a long-run average of 87.7. More than 80% expect mortgage rates to rise further.
Inside that, one line moved the other way.
| Sub-index | Oct 2026 | Change on month | Long-run average |
|---|---|---|---|
| Consumer Sentiment Index | 80.4 | -4.7% | 100.2 |
| Time to buy a dwelling | 88.4 | +3.4% | 119.1 |
| House Price Expectations | 115.1 | +4.3% | 130.2 |
| Interest Rate Expectations | 179.7 | +5.5% | 141.6 |
Source: Westpac and Melbourne Institute Consumer Sentiment Bulletin, 6 October 2026.
Buyer sentiment rose in the month of a rate rise. Westpac notes that improvements following an increase are rare but not unheard of, particularly when the index is already coming off a very weak level, and that the gain was more pronounced among outright homeowners, retirees and 25 to 34 year olds. On price expectations, 46% of consumers now expect values to rise over the next year against 31% expecting further falls.
Read that carefully rather than optimistically. The proportion saying it is a bad time to buy still outnumbers the proportion saying it is a good time in nearly all sub-groups, and Queensland buyer sentiment at 85 is weaker than New South Wales or Victoria at 93. This is not a turn. It is the first sub-index to stop falling, from a deeply pessimistic level, and in past cycles sentiment has moved before transaction data rather than after it.
What brings buyers back, in order: borrowing capacity, then confidence that they are not buying into a further fall, then urgency when they see competition return. The first of those is set by the Reserve Bank. The second is already showing a flicker. The third has not started.
The National Housing Accord commits to 1.2 million new well-located homes over the five years from mid-2024. The National Housing Supply and Affordability Council, which is the statutory body that reports on it, publishes where that stands.
As at its August 2026 quarterly report, 308,000 homes had been completed across the first seven of the twenty Accord quarters, around 26% of the target with 33% approved. There are 244,000 dwellings under construction, the highest number since records began in 1984. Approvals are up 26% and commencements up 15% on the June quarter of 2024. The Council now expects the 1.2 million to be reached in the December quarter of 2030, a quarter later than the September 2030 estimate in its April 2026 report, and roughly eighteen months beyond the Accord period itself.
| Accord progress | Queensland | South Australia |
|---|---|---|
| Share of target built | 24% | 28% |
| Share of target approved | 35% | 35% |
| Approvals, rolling 12 months | +23% | +4% |
| Completions, rolling 12 months | -2% | +16% |
| Expected to reach target | March 2031 | March 2031 |
Source: National Housing Supply and Affordability Council, Quarterly Report, 21 August 2026, data as at 6 August 2026.
Queensland is the more awkward of the two. Approvals are up 23% while completions are down 2%, which is a pipeline widening at the front and not yet clearing at the back. South Australia is converting better, with completions up 16%, from a smaller base.
What fixes this is not demand-side policy. It is the cost and feasibility of building. House construction costs are 51% higher than before COVID-19 and rose 2% in the June quarter alone. The Council's own warning is that rising costs may reduce the financial feasibility of some projects, and that softer market sentiment and the recent rate rises are expected to defer some construction.
Follow that last sentence to its conclusion and the mechanism is uncomfortable. Higher rates reduce what buyers can pay. Lower prices and weaker sentiment reduce what developers can feasibly build. Projects that do not stack up at today's costs are deferred, and a deferred project is absent supply in 2028 and 2029, not today. Meanwhile the population that will need housing in 2029 is already here.
That is the argument for why a downturn driven by credit, rather than by oversupply, tends to set up the conditions for the recovery that follows it. It is a mechanism, not a prediction, and CapitalVue is not in a position to tell you it will play out. The honest version names what would break it: sustained rate rises beyond what is priced, a material deterioration in employment, lower population growth, or the negative gearing and capital gains tax changes that take effect from 1 July 2027 repricing investor demand more deeply than anyone currently expects. The Council itself estimates those tax changes will have a modest effect on supply. Cotality attributes part of this year's drop in activity to them.
Three things separate this cycle from the eight before it, and all three argue for caution about pattern-matching too confidently.
The first is the tax change. No previous Australian downturn in the modern series ran alongside a legislated restriction of negative gearing and a replacement of the capital gains tax discount. The Treasury Laws Amendment (Tax Reform No. 1) Act 2026 received Royal Assent on 26 June 2026, with measures from 1 July 2027 and dwellings held before 7:30pm AEST on 12 May 2026 outside the negative gearing change. There is no historical cycle to compare it against.
The second is direction. This downturn began after a cutting cycle reversed, with four increases in a single year. Most of the eight followed a long tightening run rather than a whipsaw.
The third is how recently the consensus was wrong. In early July the widely reported view was that the cash rate had peaked at 4.35%, with a cut expected around mid-2027, and that Brisbane was not in a downturn at all. Twelve weeks later the cash rate was 4.60% and Brisbane recorded the steepest monthly fall of any capital city. That is not a criticism of the forecasters. It is the reason a buyer should hold a brief and a budget rather than a view about the next twelve months.
Three practical consequences.
Work out your actual capacity at 4.60%, not at the rate you were quoted earlier in the year, and stress it a further 25 basis points given Westpac expects another increase in November. A pre-approval issued in March describes a market that no longer exists.
Check the debt-to-income constraint separately from the repayment one. Since 1 February 2026 banks may write no more than 20% of new mortgages at a debt-to-income ratio of six times or higher. For higher-income borrowers with existing debt, that cap can bind before serviceability does.
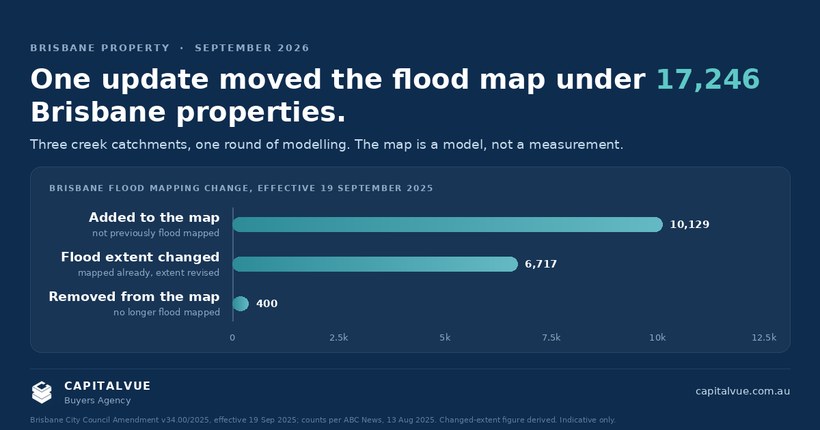
Use the conditions while they are here. More stock, fewer competing buyers and a median 39 days on market is the most negotiable set of conditions in several years, and the historical record says these conditions close faster than they open. It is also a market holding stock that did not sell for a reason, so the due diligence has to be real. A falling price does not repair a flood overlay, a structural defect or a disclosure problem, and we set out how that reading is done in our due diligence checklist and on flood specifically.
If you want your own numbers rather than the worked example above, our Buying Power Calculator takes a few minutes. Put in the rate you are actually being offered, not the one you hoped for.
General information only, not financial product advice, credit assistance, or a recommendation to buy any particular property. Borrowing capacity figures are illustrative calculations by CapitalVue on a 30-year principal and interest loan with a constant monthly repayment, using an average variable owner-occupier rate of 6.63% (Canstar, 2 October 2026) plus the 3 percentage point APRA serviceability buffer. They are not a borrowing estimate and individual lender policy, income, expenses and existing debts will produce different results. Figures are indicative and current as at October 2026. Sources: Reserve Bank of Australia Monetary Policy Decision media release, 29 September 2026, cash rate target 4.60%; Cotality (formerly CoreLogic) Home Value Index, released 1 October 2026, index results as at 30 September 2026, for values, peak-to-current, sales, listings and days on market; Domain Price Cycle data as reported 4 July 2026 for historical cycle averages; Westpac and Melbourne Institute Consumer Sentiment Bulletin, 6 October 2026; National Housing Supply and Affordability Council Quarterly Report, 21 August 2026 (data as at 6 August 2026) and State of the Housing System 2026, 30 April 2026; APRA serviceability buffer and debt-to-income lending limits; Australian Taxation Office and Treasury Laws Amendment (Tax Reform No. 1) Act 2026. Forecasts referenced are those of the named organisations, not of CapitalVue, and forecasts may prove incorrect. Past performance is not a reliable indicator of future performance. Property values can fall. Consider your own circumstances and obtain independent financial, credit, legal and tax advice before making a property decision. CapitalVue is a licensed buyers agency operating in South East Queensland and Adelaide, licensed QLD 4769773 and SA 335016.
Tell us where you are at and we will tell you what we would look at next. You will hang up with a plan, not more questions.