
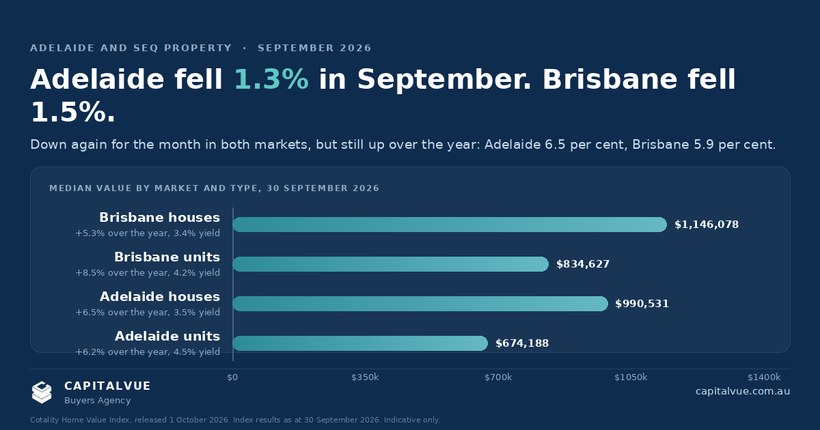
Both markets fell again in September. Both are still up over the year. Most of the commentary this month will give you only one of those.
Adelaide dwelling values fell 1.3% in September 2026 and Brisbane fell 1.5%, the steepest monthly fall of any capital city. Both markets are still up over the year, Adelaide by 6.5% and Brisbane by 5.9%, against a combined capitals figure of minus 1.8%. Those two facts belong in the same sentence.
Before the numbers, the reason. On 29 September 2026 the Reserve Bank lifted the cash rate target by 25 basis points to 4.60%, its fourth increase of the year and the highest setting since November 2011. The decision was unanimous. The next one lands on 3 November.
Rate rises do not reduce the number of people who want to buy. They reduce the amount those people are allowed to borrow. Cotality's research director Tim Lawless made the point directly in the October release, saying higher mortgage costs sit on top of elevated living expenses and negative real income growth, and that together those pressures are "narrowing the pool of buyers able to qualify for a mortgage".
Everything below is downstream of that.
| Market | Month | Quarter | Annual | Gross yield | Median dwelling value |
|---|---|---|---|---|---|
| Adelaide | -1.3% | -2.7% | +6.5% | 3.6% | $928,560 |
| Brisbane | -1.5% | -4.7% | +5.9% | 3.5% | $1,048,880 |
| Regional SA | -0.1% | +1.7% | +10.7% | 4.4% | $564,017 |
| Regional Qld | -0.9% | -2.5% | +6.3% | 4.3% | $834,425 |
| Combined capitals | -1.2% | -4.3% | -1.8% | 3.7% | $973,525 |
| National | -1.1% | -3.7% | 0.0% | 3.9% | $899,236 |
Source: Cotality Home Value Index, released 1 October 2026, index results as at 30 September 2026.
The quarterly column is where the two markets separate. Adelaide is down 2.7% over three months and sits 2.9% below its May 2026 peak. Brisbane is down 4.7% and sits 5.4% below the same peak. Nationally, values are 5.2% below the March 2026 high, and Cotality reports that 97% of capital city suburbs fell over the three months to September. Darwin, up 0.4% for the month, was the only capital that did not fall. Adelaide is correcting more slowly than almost anywhere else on the mainland.
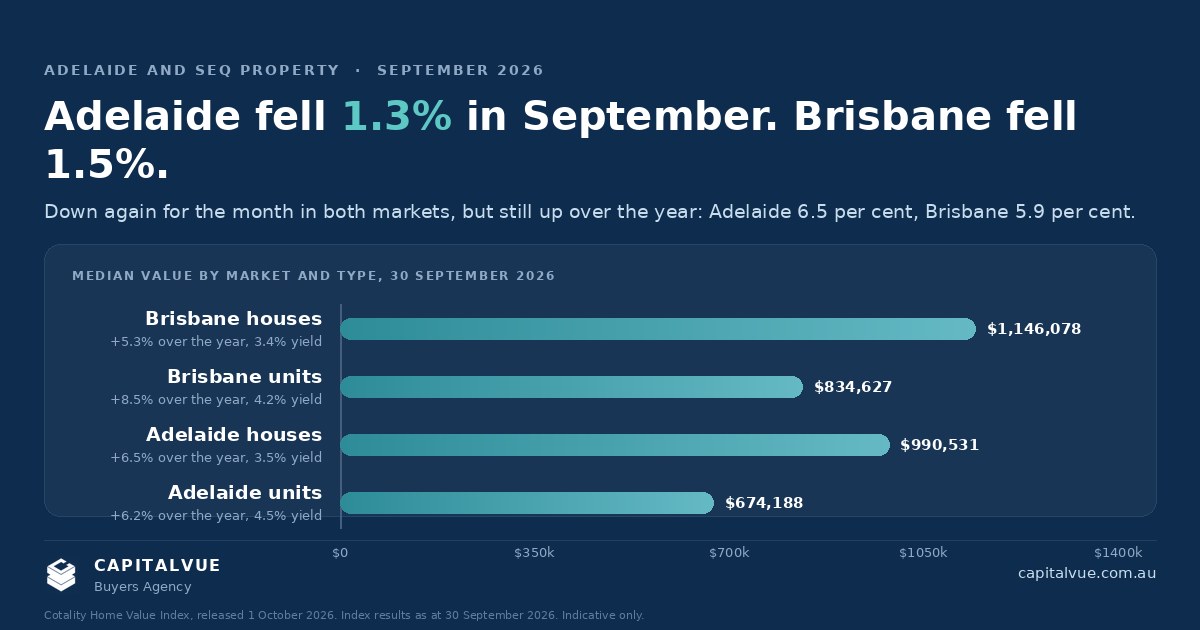
| Market and type | Month | Annual | Gross yield | Median value |
|---|---|---|---|---|
| Adelaide houses | -1.4% | +6.5% | 3.5% | $990,531 |
| Adelaide units | -1.1% | +6.2% | 4.5% | $674,188 |
| Brisbane houses | -1.5% | +5.3% | 3.4% | $1,146,078 |
| Brisbane units | -1.4% | +8.5% | 4.2% | $834,627 |
Source: Cotality Home Value Index, released 1 October 2026.
Brisbane units are the standout of the four. They recorded the strongest annual growth at 8.5%, a gross yield of 4.2% against 3.4% for Brisbane houses, and a total return of 13.0% against 8.7%. Adelaide units carry the highest yield of the four at 4.5% on the lowest entry price.
That is not an argument that units beat houses. Land content still drives long-run capital growth, and a unit in a large complex carries body corporate exposure a house does not. It is an argument that in a market where borrowing capacity is the binding constraint, the asset that clears at $674,188 with a 4.5% yield behaves differently from the one that clears at $1,146,078 with a 3.4% yield, and the two should not be assessed with the same spreadsheet.
National residential vacancy reached 2.0% in September, up from a record low of 1.5% in February 2026 and the highest reading since January 2025. It remains well below the pre-COVID decade average of 3.3%.
| Market | Vacancy rate | House rent growth | Unit rent growth |
|---|---|---|---|
| Adelaide | 1.4% | +6.3% | +6.1% |
| Brisbane | 2.1% | +6.7% | +5.9% |
Source: Cotality Home Value Index, released 1 October 2026, annual change in rents to September 2026.
Adelaide is the tightest capital city rental market in the country at 1.4%. Brisbane has loosened to 2.1%, level with Perth, with Hobart the loosest at 3.0% and Sydney at 2.3%.
Rental growth is still positive but it is decelerating. The monthly pace eased to 0.3% in seasonally adjusted terms, the smallest monthly rise since May 2025, taking the national annual rate to 5.5%. Cotality attributes the rise in vacancy partly to a structural response rather than new supply, with renters forming larger households to cope with stretched affordability. Lawless noted that weekly rents have risen by roughly $200 across the country over the past five years, a period he described as unprecedented rental growth that has pushed affordability to the worst levels on record.
Yields are rising anyway, because values are falling faster than rents are slowing. National gross yields reached 3.85%, the highest since August 2019. For an investor that is the number that matters, and it is improving for the least comfortable reason.
Three numbers describe the shift better than the price falls do. Sales volumes over the three months to September ran 19.1% below a year ago nationally and 13.3% below the five-year average. New listings coming to market were 9.2% lower than a year ago, yet total advertised inventory was 23.1% higher. Capital city homes now take a median of 39 days to sell, against 23 days a year ago.
Brisbane carries the sharpest fall in turnover of any capital, with sales down 27.2% year on year.
More stock, fewer competing buyers, and more than two additional weeks on market. That is the mechanical definition of negotiating leverage, and it is why a prepared buyer is better placed now than in any month since early 2024.
It is also why due diligence matters more, not less. A market with this much standing inventory is a market holding stock that failed to sell for a reason. Sometimes the discount reflects conditions. Sometimes it reflects a flood overlay, a structural defect or a disclosure problem. Falling prices do not convert a bad asset into a good one. We set out what a flood map does and does not tell you in a separate piece, and in this market that reading matters more than it did a year ago.
Annual growth has not disappeared from either market, it has moved to the affordable end. In Greater Brisbane the strongest twelve-month performers were Sherwood - Indooroopilly at 10.7%, Ipswich Hinterland at 10.1% and Beenleigh at 9.1%. In Greater Adelaide they were Onkaparinga at 10.1%, Gawler - Two Wells at 9.6% and Campbelltown at 9.2%. Regional South Australia recorded 10.7% for the year and was close to flat for the month at minus 0.1%.
With the exception of Sherwood - Indooroopilly and Campbelltown, that is a list of outer and middle-ring markets. Where borrowing capacity is the constraint, demand concentrates where the deposit hurdle is lowest.
Cotality attributes part of the drop in activity to the negative gearing and capital gains tax changes announced in the Federal Budget, which it says have already produced a sharp reduction in investor demand. Those changes are now law. The Treasury Laws Amendment (Tax Reform No. 1) Act 2026 received Royal Assent on 26 June 2026 and the measures start from 1 July 2027, with dwellings held before 7:30pm AEST on 12 May 2026 outside the negative gearing change.
If you hold or are planning to acquire investment property, that is a conversation to have with your own accountant before your next purchase rather than after it. We are buyers agents, not tax advisers, and the arithmetic here is specific to your circumstances.
The temptation in a falling market is to wait for the bottom. The bottom is only visible afterwards, and the conditions that make this market worth buying into, which are the extra stock, the longer selling times and the thinner competition, are the first things to disappear when sentiment turns. Cotality's own expectation is a gradual drift lower rather than a material downturn, and it flags the possibility of another rate rise in November. Rates are the variable to watch, not prices.
Our position for both Adelaide and South East Queensland is that this is a market to buy selectively in rather than sit out, provided the asset survives due diligence and the numbers work at 4.60% rather than at a rate you are hoping for.
If you want to know what your borrowing capacity actually looks like at the current cash rate before you start inspecting, our Buying Power Calculator is the place to start. It takes a few minutes and it is free.
General information only, not financial product advice, credit assistance, or a recommendation to buy any particular property. Figures are indicative and current as at October 2026. Sources: Cotality (formerly CoreLogic) Home Value Index, released 1 October 2026, index results as at 30 September 2026, including the vacancy, rental, yield, sales, listings and days on market figures and the SA3 growth lists; Reserve Bank of Australia, Monetary Policy Decision media release, 29 September 2026, cash rate target 4.60% effective 30 September 2026; Australian Taxation Office, Reforming negative gearing and capital gains tax, and Treasury Laws Amendment (Tax Reform No. 1) Act 2026. Index figures are revised from time to time and different index providers report different results for the same month. Past performance is not a reliable indicator of future performance. Property values can fall. Consider your own circumstances and obtain independent financial, credit, legal and tax advice before making a property decision. CapitalVue is a licensed buyers agency operating in South East Queensland and Adelaide, licensed QLD 4769773 and SA 335016.
Book a free strategy call. We'll pressure-test your goals, show you what's possible, and tell you honestly whether we can help.