
A council flood map is a screening test. Buyers treat it as a diagnosis.
In clinical work you learn early that a screening test is not a diagnosis. A negative result narrows the field. It does not clear the patient. The test has a defined sensitivity, it was run on a particular day, and it answers one question rather than every question you care about.
I sit with owner-occupiers every week who have typed an address into the Brisbane City Council Flood Awareness Map, seen nothing shaded, and decided the flood question is closed. Sometimes they are right. Often they have simply asked a narrow question and received a narrow answer, then heard it as an all clear.
Here is what the map is actually telling you, what it leaves out, and what each finding should change about your decision.
Brisbane's flood mapping is not a record of where water has been. It is the output of hydraulic modelling, built from catchment studies, and it is updated when the studies are.
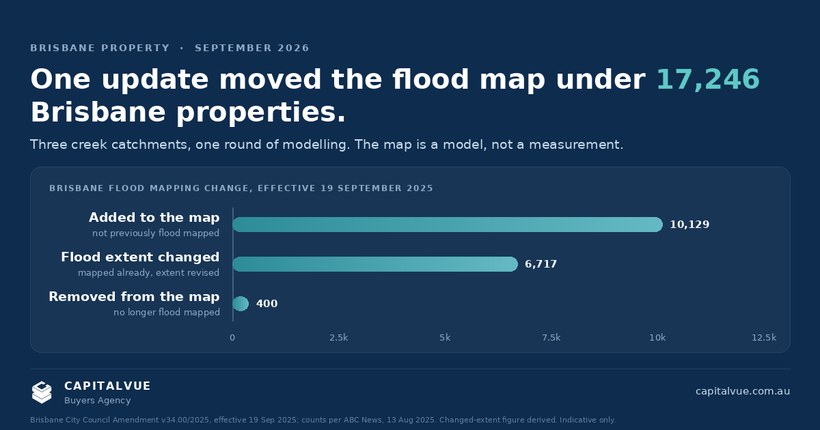
On 19 September 2025 an update to the Brisbane City Plan 2014 flood overlay took effect, drawn from new studies of three catchments: Breakfast Creek, Jindalee Creek and Lota Creek. It affected 17,246 properties. Of those, 10,129 were added to the flood mapping for the first time and 400 came off it. The balance stayed on the map with a changed flood risk extent, and more than 2,000 of them moved into a higher risk category.
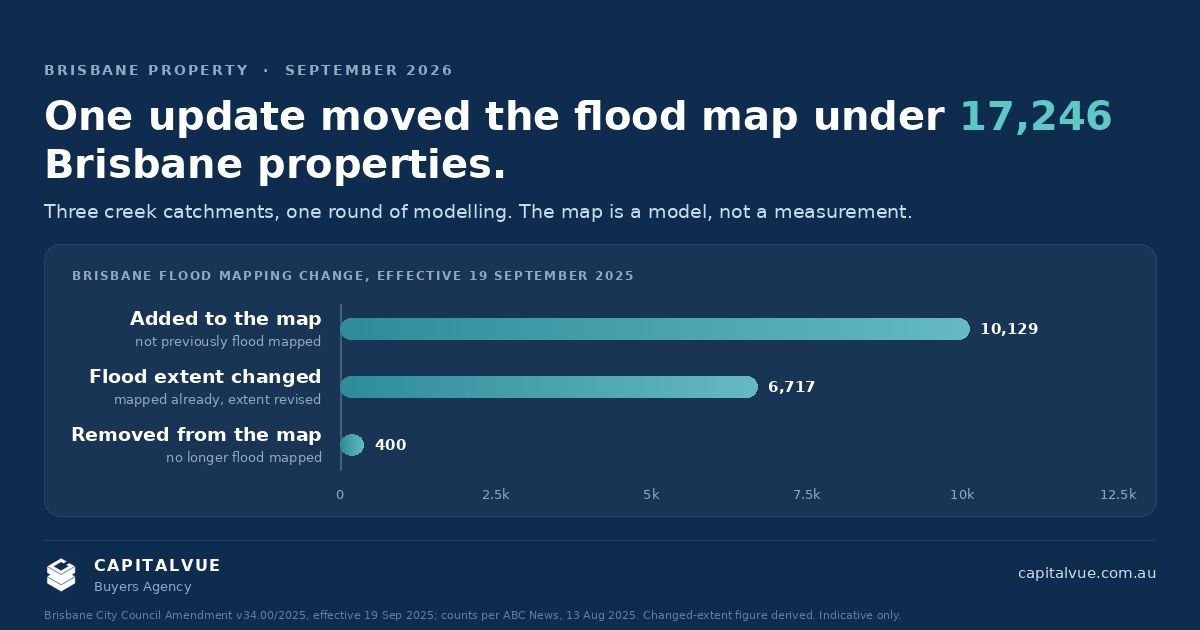
Three creeks. One round of modelling. More than ten thousand Brisbane properties that sat outside the creek flood mapping on 18 September were inside it on 19 September.
Nothing physical happened to those properties overnight. The model improved.
That update also covered creek and waterway flooding only. It did not touch the Brisbane River mapping or overland flow, which rest on their own studies and change on their own timetables.
What that finding actually means: a clear map result carries a date and a catchment behind it. If your suburb's catchment study is old, your clear result is a statement about the age of the study as much as about your property. Ask when the relevant catchment was last modelled, and for which flood source.
Council runs the Flood Awareness Map as an awareness tool, showing the probability of flooding from creek, river and storm tide, with overland flow handled separately. The City Plan 2014 flood overlay is the regulatory map, the one that drives what you can build and what conditions attach to a development application.
They are not the same map, and they do not update in step. Council states plainly that changes to Brisbane City Plan 2014 are a regulated process and that updating the flood overlay map "may take longer to implement".
So a property can sit in the awareness mapping while the regulatory overlay has not caught up, or the reverse.
What that finding actually means: if you are buying to renovate, raise, extend or subdivide, the awareness map is the wrong document to plan against. Check the overlay that will actually govern your application.
A FloodWise Property Report covers four flood sources: river, creek, overland flow and storm tide. That sounds complete. Read the report carefully and you find that overland flow information appears in the Planning and Development Information section and "is not included in the provided graph or map".
Overland flow is stormwater running across the ground toward a drain, on its way somewhere else. It does not need a river. It needs rain, a slope and a drainage system at capacity. It is also the flood source that most often surprises people who checked the map, because the part of the report they actually looked at, the graph, did not show it.
Council also grades it differently. River, creek and storm tide are described by likelihood: high is a 1 in 20 chance in any year, medium 1 in 100, low 1 in 500, very low 1 in 2000. Overland flow is described by impact instead, as high, medium or low.
What that finding actually means: read past the graph to the Planning and Development Information section. A property with no river or creek exposure and a high overland flow impact rating is a property with a flood problem.
Flood mapping is drawn across land. Your exposure is set by the height of the lowest habitable floor relative to the modelled flood level.
Two houses on the same street, both partly within the same mapped extent, can be entirely different purchases. One is a post-war Queenslander with habitable rooms well above the flood planning level and a garage underneath that will get wet and dry out. The other is a slab on ground at the low point of the block. The map shades them similarly. The insurance, the repair bill and the resale conversation are nothing alike.
This is also where the report can be out of date in your favour. Council will review flood levels and ground or floor levels on the strength of certified evidence, including survey levels from a licensed surveyor and hydraulic assessments certified by a Registered Professional Engineer of Queensland.
What that finding actually means: a mapped lot is a prompt to get a floor level survey, not a reason to walk. The survey is the finding that decides it.
Council is direct about this. It says it "has no control over how insurance companies determine and calculate premiums for flood risk", and it notes that insurers draw on several data sources, including the National Flood Information Database, and may use their own flood mapping. The planning scheme, Council says, is not intended to be used for insurance or valuation purposes.
The National Flood Information Database was assembled by the Insurance Council of Australia and estimates flood risk for roughly 14 million Australian homes. It is proprietary. Insurers who pay can see it. The household buying the house cannot.
That gap is worth sitting with. On the question of how likely this specific house is to flood, the insurer knows more than you do, and it will not show you its workings.
What it will do is give you a price. A quote is the insurer's private assessment of the risk, converted into a number you are allowed to see. It is the closest thing a buyer has to reading the model directly, and it costs a phone call.
The scale of what insurers are pricing is not small. The Insurance Council of Australia records the February and March 2022 South East Queensland and New South Wales floods, catastrophe 221, at $6.37 billion in claims incurred across 246,000 claims. Ex-Tropical Cyclone Alfred in 2025, catastrophe 252, added a further $1.61 billion across 131,000 claims.
What that finding actually means: get a real insurance quote on the actual address, in writing, before your finance and due diligence conditions expire. Not an estimate for the suburb. A quote for the lot. If the premium is punitive or cover is declined, you have learned something the map could not tell you, and you have learned it while you can still walk away.
Queensland's seller disclosure scheme commenced on 1 August 2025 under the Property Law Act 2023. Before a contract is signed, a seller must give the buyer a Form 2 seller disclosure statement with prescribed certificates covering title, encumbrances, land use and planning, and building notices.
It is a real improvement. It is also narrower than buyers assume.
The Queensland Government lists, among the details a seller is not required to include in the disclosure statement, the structural soundness of the building, previous building or development approvals, and flooding history.
Read that last one again. A house that took water through the living room in 2022 can be sold with a complete, compliant, entirely clean Form 2.
That is not the same as permission to mislead. A seller or agent who is asked a direct question still cannot give you a false answer. So ask, in writing, before you sign: has this property ever been inundated, and has a flood insurance claim ever been made on it.
What that finding actually means: a clean Form 2 is evidence that the seller met a disclosure obligation. It is not evidence that the house has never flooded. Those are different claims and only one of them is being made.
Not every buyer needs all of these, and not every property warrants them. This is the menu, and what each item actually answers.
| Check | What it answers | Why it earns its place |
|---|---|---|
| FloodWise Property Report, full read | River, creek, storm tide and overland flow at this lot | The graph alone omits overland flow |
| Catchment study date | How current the model behind the result is | 10,129 properties were added in one 2025 update |
| City Plan flood overlay check | What you will be allowed to build | The overlay and the awareness map update at different speeds |
| Licensed surveyor floor level | Height of habitable floor against flood planning level | The map shades the lot, not the floor |
| Written insurance quote on the address | What the insurer's private model thinks | Insurers price off data buyers cannot see |
| Written question to the selling agent | Known inundation or flood claims | Form 2 does not have to disclose flood history |
| Historic flood imagery, 2011 and 2022 | Where water actually went | Records outlast ownership changes |
| Building and pest, read for water damage | Evidence of past inundation in the structure | Physical evidence outlasts paperwork |
The first three cost nothing but an afternoon. Start there. If those turn up anything, the floor level survey and the insurance quote are the two that settle it, and both need to happen while your conditions are still live rather than after.
The map is a good screening test. Use it that way. A shaded lot is a prompt for a floor level survey and an insurance quote, not a reason to walk away from a house that suits you. An unshaded lot is a narrower answer than it looks, and it is worth the same two phone calls.
The buyers who get hurt in South East Queensland are rarely the ones who found flood risk and priced it. They are the ones who checked a map, saw white, and stopped asking.
If you are buying in Brisbane and want the due diligence run properly before you commit, see how our Brisbane buyers agent service works, or start with a free Property Readiness Snapshot and we will tell you what we would check on the addresses you are already watching.
| Figure or statement | Source | Date |
|---|---|---|
| Amendment v34.00/2025; Breakfast Creek, Jindalee Creek and Lota Creek catchments; creek and waterway flooding only | Brisbane City Council, Flood overlay mapping minor amendment package V | Adopted 12 Aug 2025, effective 19 Sep 2025 |
| 17,246 properties affected; 10,129 added; 400 removed; more than 2,000 moved to a higher category | Brisbane City Council announcement, as reported by ABC News and Inside Local Government | 12 and 13 Aug 2025 |
| 6,717 with a changed flood extent | Derived: 17,246 less 10,129 added and 400 removed | As above |
| Flood overlay updates "may take longer to implement" | Brisbane City Council, Check your disaster risk | Accessed 17 Sep 2026 |
| Overland flow "not included in the provided graph or map" | Brisbane City Council, FloodWise Property Report | Accessed 17 Sep 2026 |
| Likelihood categories 1 in 20, 1 in 100, 1 in 500, 1 in 2000 | Brisbane City Council, Understanding flood likelihood and impact | Accessed 17 Sep 2026 |
| Council has no control over premiums; insurers use NFID and their own mapping | Brisbane City Council, Flood technical review process and level updates | Accessed 17 Sep 2026 |
| NFID estimates risk for roughly 14 million homes and is proprietary | Melser, Settle and Perugia, "Insurers have detailed data on your home's flood risk. So, why don't you?", The Conversation | September 2025 |
| CAT 221: $6.37bn claims incurred, 246,000 claims | Insurance Council of Australia, Catastrophe 221 | Data as at 6 Mar 2025; page updated 28 May 2026 |
| CAT 252 ex-TC Alfred: $1.61bn claims incurred, 131,000 claims | Insurance Council of Australia, Catastrophe 252 | Data as at June 2026; page updated 5 Aug 2026 |
| Seller disclosure commenced 1 Aug 2025; flooding history not required | Queensland Government, Seller disclosure scheme; Property Law Act 2023 (Qld) | Accessed 22 Sep 2026 |
General information only, not financial product advice, credit assistance, legal advice, or a recommendation to buy any particular property. Figures are indicative and current as at September 2026. Sources: Brisbane City Council flood information and City Plan Amendment v34.00/2025 (effective 19 September 2025); Insurance Council of Australia catastrophe data (CAT 221 as at 6 March 2025, CAT 252 as at June 2026); The Conversation, September 2025; Queensland Government seller disclosure scheme guidance under the Property Law Act 2023 (Qld) (scheme commenced 1 August 2025). Flood mapping is revised as new studies are adopted; check the current Council mapping for any specific property. Past performance is not a reliable indicator of future performance. Property values can fall. Consider your own circumstances and obtain independent financial, credit, legal and tax advice before making a property decision. CapitalVue is a licensed buyers agency operating in South East Queensland and Adelaide, licensed QLD 4769773 and SA 335016.
Book a free strategy call. We'll pressure-test your goals, show you what's possible, and tell you honestly whether we can help.