Two numbers, one index, one release. Only one of them describes the market you would buy into this week.
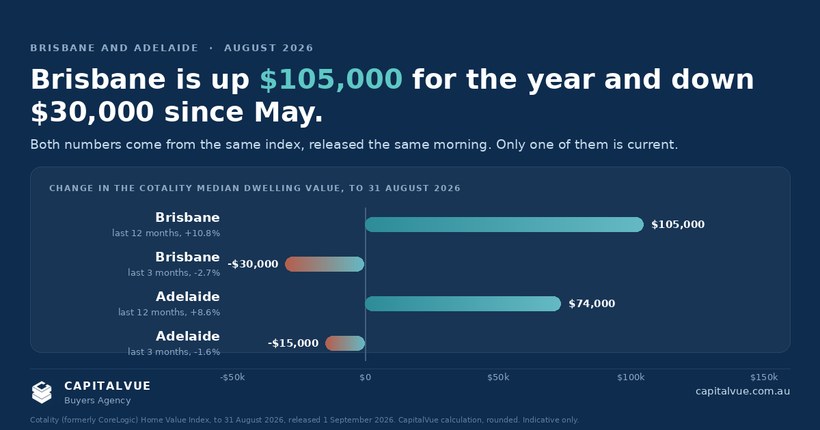
Brisbane dwelling values are up 10.8% over the last twelve months. They are also down 2.7% over the last three. Both figures come from the same index, released on the same morning.
That is the whole story of August. The annual number is a rear-view mirror, and it is the number most headlines and most selling agents will quote until roughly February, because it is the flattering one. The quarterly number is the market. Cotality's index recorded a fifth consecutive national fall in August, leaving national values 3.6% below their March 2026 peak.
| Market | Aug 2026 | Quarter | 12 months | Median dwelling value |
|---|---|---|---|---|
| Brisbane | -1.0% | -2.7% | +10.8% | $1,080,142 |
| Adelaide | -0.8% | -1.6% | +8.6% | $937,207 |
| Regional Qld | -0.5% | -1.3% | +9.1% | $844,803 |
| Regional SA | +0.6% | +2.3% | +11.4% | $570,005 |
| Combined capitals | -1.1% | -3.7% | +1.1% | $990,394 |
| National | -0.9% | -3.1% | +2.7% | $912,885 |
Source: Cotality (formerly CoreLogic) Home Value Index, index results as at 31 August 2026, released 1 September 2026.
Two things in that table are worth more than the headline. The first is that Adelaide is falling at roughly half Brisbane's quarterly rate, and Brisbane is falling faster than the regional Queensland market beneath it. The second is Regional SA, which rose 0.6% in August and 2.3% over the quarter, the strongest three-month result of any market in the table. Darwin, at +0.6% for the month, was the only capital city that did not fall. Read together, those two lines say the downturn is concentrated in the capitals and at the higher price points rather than spread evenly across the country.
Within Brisbane, units are still outrunning houses on the annual figure, +13.2% against +10.3%, and falling slightly less over the quarter, -2.0% against -2.9%. In Adelaide the two are almost indistinguishable, at +9.0% and +8.6% annually.
On the same day Cotality published Brisbane at -1.0% for August, the REA Group home price index produced by PropTrack published Brisbane at -0.3%. That is not a rounding difference. It is a factor of three.
| Market | Cotality, Aug | REA Group, Aug | Cotality, 12 mth | REA Group, 12 mth |
|---|---|---|---|---|
| Brisbane | -1.0% | -0.3% | +10.8% | +7.5% |
| Adelaide | -0.8% | -0.9% | +8.6% | +8.0% |
| National | -0.9% | -0.2% | +2.7% | +1.8% |
Sources: Cotality Home Value Index, released 1 September 2026; REA Group home price index produced by PropTrack, August 2026 results, released 1 September 2026.
The gap is a methodology gap, not an error. The two indices weight property types, price segments and geographies differently, and they revise on different schedules. Notice that they agree almost exactly on Adelaide and diverge sharply on Brisbane, which is what you would expect when a market is moving quickly and the composition of what actually sold in the month is unusual.
The practical consequence is the one worth carrying into a negotiation. An index measures a market. It does not value your property, and it does not value the one you are about to bid on. When a selling agent tells you the market is only off a fraction of a per cent, ask which index. When they tell you it is up double digits, ask over what period. Both answers are available and neither is a valuation.
The cash rate target has been 4.35% since 5 May 2026, the third increase of the year, and the Reserve Bank has now held there twice, on 16 June and again on 11 August. The August decision was unanimous, and Governor Michele Bullock used the media conference to keep the door open to a further increase rather than to signal a cut. The next decision lands on 29 September.
Borrowing capacity is the mechanism. Three increases in a single year removes a meaningful share of what a buyer can borrow, and price follows capacity with a lag of a few months. That lag is why the annual figure still looks strong while the quarterly figure does not.
Demand has thinned accordingly. Cotality's quarterly estimate has home sales tracking 15.5% below the same time last year and 11.5% below the five-year average, with Brisbane among the capitals recording the largest falls in transaction activity. Stock has built up behind that. Over the four weeks to 30 August, capital city listings were 24% higher than a year earlier and 8% above the five-year average, and that is despite fewer new listings coming to market, not more.
Rents. This is the part of the August data most commentary skipped, and it comes with a measurement caveat worth stating before the numbers.
| Measure | Brisbane | Adelaide |
|---|---|---|
| Vacancy rate, Jul 2026 | 0.9% | 0.6% |
| Advertised rent, combined | $755 pw | $643 pw |
| Change, 12 months | +7.5% | +3.3% |
| Advertised rent, houses | $845 pw | $690 pw |
| Change, 12 months | +9.1% | +3.2% |
Sources: SQM Research national vacancy rates, July 2026, released 13 August 2026. SQM Research weekly rents index, week ending 28 August 2026.
The caveat is that vacancy is measured two ways and the two do not agree. SQM counts listings advertised for three weeks or more and put the national rate at 1.3% in July, with Brisbane at 0.9% and Adelaide at 0.6%. Cotality, on its own measure, put the national rate at 1.9% in August, its highest since January 2025, and Adelaide at 1.3% as the tightest mainland capital. The same divergence problem that shows up in the price indices shows up here, and the honest reading sits between them: rental availability is rising off record lows, and it is still far below anything that would be called balanced, which is conventionally nearer 3%.
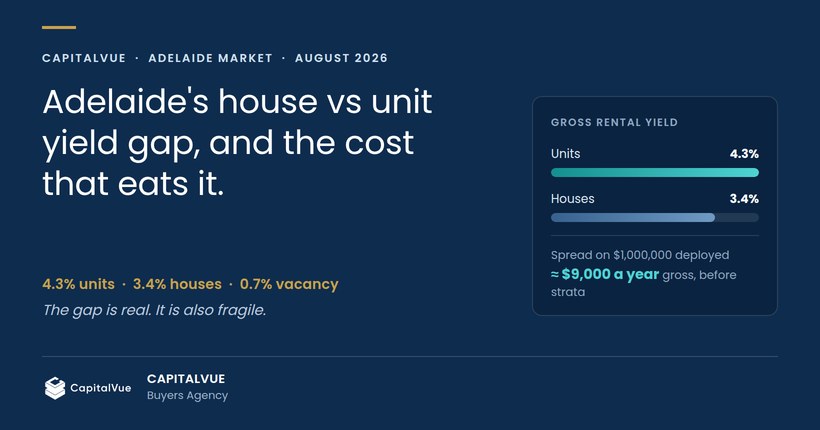
What both series agree on is direction. Rents are still rising while values fall. Nationally, Cotality has rents up 5.7% over the year, and the gross rental yield at 3.79%, its highest level since September 2019. Brisbane's gross dwelling yield sits at 3.4% and Adelaide's at 3.6% as at 31 August.
For an investor that combination is the point of paying attention this month. When the denominator falls and the numerator rises, the yield repairs. Those are still thin numbers on an absolute basis, and Cotality's research director Tim Lawless put the limit on it plainly in the same release, saying yields would need to rise substantially before rental income offsets holding costs while interest rates remain elevated. A gross yield is not a return. Rates, insurance, body corporate contributions and management costs all sit between the two.
Fewer buyers at open homes, more stock to choose from, longer selling times and vendors whose price expectations were set in a market that ended in March. That is a better set of conditions than any month in the past two years for a buyer who has finance ready and a brief they can hold to.
It is a worse set of conditions for anyone who needs the market to keep rising to make their numbers work. Falling values reward patience and punish leverage taken on the assumption of growth.
One dated item to have on your radar rather than react to. The Treasury Laws Amendment (Tax Reform No. 1) Act 2026 received Royal Assent on 26 June 2026. From the 2027 to 2028 income year it limits negative gearing on established residential dwellings acquired after 7:30pm AEST on 12 May 2026, and from 1 July 2027 it replaces the 50% CGT discount for individuals, trusts and partnerships with cost base indexation and a 30% minimum tax rate on capital gains. Dwellings held at that 12 May 2026 cut-off are outside the negative gearing change, and new residential dwellings and qualifying affordable housing can still elect the discount. Whether that produces a rush of acquisitions before July 2027 or simply reprices investor demand is not something anyone can tell you honestly yet. What it does mean is that the structure and timing of an investment purchase now carries more weight than it did last year, and that is a question for your accountant with your actual numbers in front of them, not a question for a market update.
If Brisbane is the market you are looking at, what we do, what it costs and where we buy in South East Queensland is set out here. Our fees are published, fixed and quoted before a search starts.
If you are earlier than that, the Property Readiness Snapshot takes a few minutes and tells you which of the three things that usually stall a purchase, finance, brief or timing, is the one actually stalling yours.
We will publish the September numbers in the second week of October.
General information only, not financial product advice, credit assistance, or a recommendation to buy any particular property. Figures are indicative and current as at September 2026. Sources: Cotality (formerly CoreLogic) Home Value Index, index results as at 31 August 2026, released 1 September 2026, including sales volume, listings, rental and gross yield commentary; REA Group home price index produced by PropTrack, August 2026 results, released 1 September 2026; SQM Research national vacancy rates July 2026, released 13 August 2026, and SQM Research weekly rents index, week ending 28 August 2026; Reserve Bank of Australia Monetary Policy Decision media releases, 5 May 2026, 16 June 2026 and 11 August 2026, cash rate target 4.35%; Australian Taxation Office, Reforming negative gearing and capital gains tax, and Treasury Laws Amendment (Tax Reform No. 1) Act 2026. Vacancy rate measures differ between providers and are not directly comparable. Past performance is not a reliable indicator of future performance. Property values can fall. Consider your own circumstances and obtain independent financial, credit, legal and tax advice before making a property decision.
Tell us where you are at and we will tell you what we would look at next. You will hang up with a plan, not more questions.